How To Be A Data-Based Business
by Max von BeustThis is part 6 of my master thesis on Monetization Strategies and Business Models Behind Consumer Data. Find other chapters here:
4 Data-Based Business Models
As mentioned above, the new reality of data collection and consumers as data models has the potential of creating opportunities for business which are outlined in the following chapters. The goal is to identify use-cases that harness the power of these developments in order to tackle the core challenge of monetization and value delivery as described in chapter 2.5. In addition, new and unique business model opportunities are outlined. The first subchapters deal with the methodology used for business-model-identification and the capabilities of data-based businesses. The subsequent chapters include a discussion of various case studies followed by a general classification of data-based business models. The chapter is concluded with an insight into possible challenges of and risk factors for data-based businesses.
4.1 Identification of Business Models
Business models are defined with transactions for value creation in mind, as identified in chapter 2.1 based on the comparison
of various business models. This generation and exchange of value in business models through transactions
and resources is described by DaSilva and Trkman (2014, p. 383).
Following this definition, this thesis will focus on value streams between players (see chapter 2.3 on
p.7) in business models. The aim is to identify business models by analyzing carefully selected cases.
First, the advantages of this method are discussed, after which the main drawback is presented.
A schematic, value-flow-based identification of business models has several advantages: It enables a
high-level overview of the contribution (financial, product, information, data flows) of the essential
players to a business model, allows for comparisons and gives the opportunity to fully understand the
position a specific actor has within the value chain. This concept of identification and description
of business models was first used by Weill and Vitale (2001, pp. 36–39). The conceptualization based
on value flows also highlights crucial participants, such as consumers, customers, partners and businesses.
Additionally, the core relationships between these players are depicted and dependencies and access to
specific resources are highlighted. Finally, the core flows of value, resources and their use for additional
value creation and monetization are emphasized.
The main drawback is that an analysis of value flows cannot give a detailed, holistic, or quantitative
view of a business model. A concept such as the business model canvas would be able to show more granular
information (Osterwalder & Pigneur, 2010), but would exceed the scale and scope of this thesis. As a
consequence, not every activity, resource, consumer and customer will be analyzed or depicted.
4.2 Capabilities of Data-Based Businesses
Before analyzing the different value streams and participants in the environment of a business that then are compiled to
a business model, it is useful to describe certain internal capabilities and activities of a data-based
business. The chapters on data evolution and consumers as data models have demonstrated the rising complexity
of activities related to data - be it collection, storage or computing. In order to deal with the significant
increase in volume, velocity and variety of data (sources), specific prerequisites have to be fulfilled
by a company, be it within the company itself or when outsourcing. The two most common data value chain
models will be presented, after which each step will be discussed in detail in order to explain the necessary
requirements of a data-based business.
Firstly, an approach to finding relevant areas of competence is to analyze the value chain of data as
first described by Rayport and Sviokla (1995). This value chain is composed of five different phases:
gathering, organizing, selecting, synthesizing and distributing data. Throughout these phases, data is
seen as the raw material, which is collected through various input measures, leading to the need for
organization and structuring. After organizing, it is possible to select specific data, synthesize (or
analyze) it and distribute the generated information in a meaningful way. Each phase in this process
ideally leads to additional value. (Rayport & Sviokla, 1995, p. 81).
Secondly, Miller and Mork (2013, p. 58) presented a data value chain with a different configuration which
is divided into seven distinct steps, which in turn are grouped into three main phases: data discovery,
-integration and -exploitation. Building upon the system described by Rayport and Sviokla, Miller and
Mork start their value chain with the collection and annotation of data - this means collecting and structuring
data, which is followed by the preparation of data. The latter step includes giving developers access
to the data, which is then organized into a fitting format. All these steps are grouped into the discovery
phase. Then different data sources are combined to make for a larger and more diverse basis of analysis
in the integration phase. The last phase is data exploitation which starts with the analysis of data.
The outcome of the analysis is visualized and decisions are made. (Miller & Mork, 2013, pp. 57–59)
Hartmann et al. (2016, p. 1387) use the three-phase model proposed by Rayport and Sviokla for their analysis
of data-driven business models, with the small addition of splitting the analysis step into three different
possible sub-steps: descriptive, predictive and prescriptive analysis.
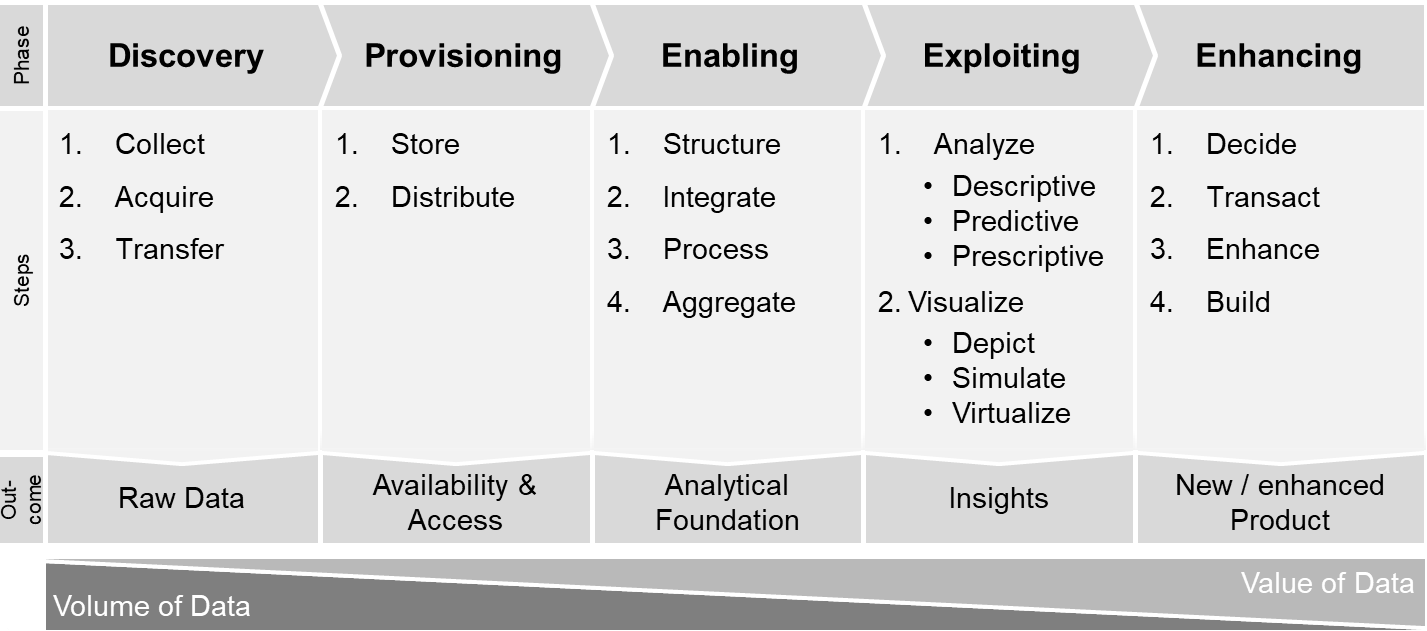
the data value chain of capabilities consists of five consecutive and distinct phases; each is split into specific activities
In order to describe the capabilities a data-based business should have, the different models of the data value chain can
be combined and enriched with additional insights. The resulting data value chain of capabilities (see
Figure 7) consists of five consecutive and distinct phases; each is split into specific activities. The
starting point is the discovery phase where data is collected (internally) or acquired (externally) and
then transferred to a centralized system in the network. Here, data is securely stored on a storage device
(e.g. a server) from where it can be distributed to a computing engine. This phase is the provisioning
phase - its goal is to provide data by ensuring its availability and access. The next, enabling, phase
in this sequence aims at building an analytical foundation i.e. structuring data, integrating additional
sources, including basic processing (e.g. for data cleaning) and aggregating data.
The last two phases of the data value chain have the most substantial impact on value creation: exploiting
and enhancing. During the phase of exploitation, data is analyzed and possibly visualized, be it to show
outcomes, simulate predictions or virtualize reality. The outcome of this phase is the generation of
insights from the data collected. Current developments are showing that certain parts of provisioning,
enabling, and exploiting phases can possibly be merged at some point in the future, as the main logic
for the current data value chain is based on the technical limitation of the von Neumann architecture
which does not allow for simultaneous processing and storing of data (Editorial Nature, 2018, pp. 145–146).
It is in the enhancing phase that the difference between data-based and data-driven businesses is most
evident: Data-driven businesses can be found as specialists at all of the different phases or steps of
the data value chain, but data remains a product in itself, is only used for decision-making or is only
collected internally (Hartmann et al., 2016, pp. 1391–1392). A data-based company collects consumer data
for revenue generation, and in advanced cases, enhances its current product or builds entirely new products
with consumer data as the foundation and key resource. These essential steps that clearly differentiate
a data-based company from a data-driven company are all found in the enhancing phase, and include, but
aren't limited to, data-based decision-making, transaction-enablement and product enhancement.
A data-based company collects consumer data for revenue generation, and in advanced cases, enhances its current product or builds entirely new products with consumer data as the foundation and key resource
This five-phase model will be used as a tool for identifying different classifications of data-based business models. What can be observed during the process of data moving through these different phases is a decrease in the volume of data that has to be processed. Furthermore, the value of data increases by conversion into information and knowledge. (MacDonald & Lee, 2013)

4.3 Value Streams in Online Business Models
To gain access to data, businesses have to provide significant additional value to consumers - the more personal the data and the less sophisticated the monetization system, the more value is expected by a consumer (Morey et al., 2015, p. 103). As the different players in online business models have already been described in chapter 2.3, this chapter shall give a short overview of the three most relevant categories of value streams.
the more personal the data and the less sophisticated the monetization system, the more value is expected by a consumer
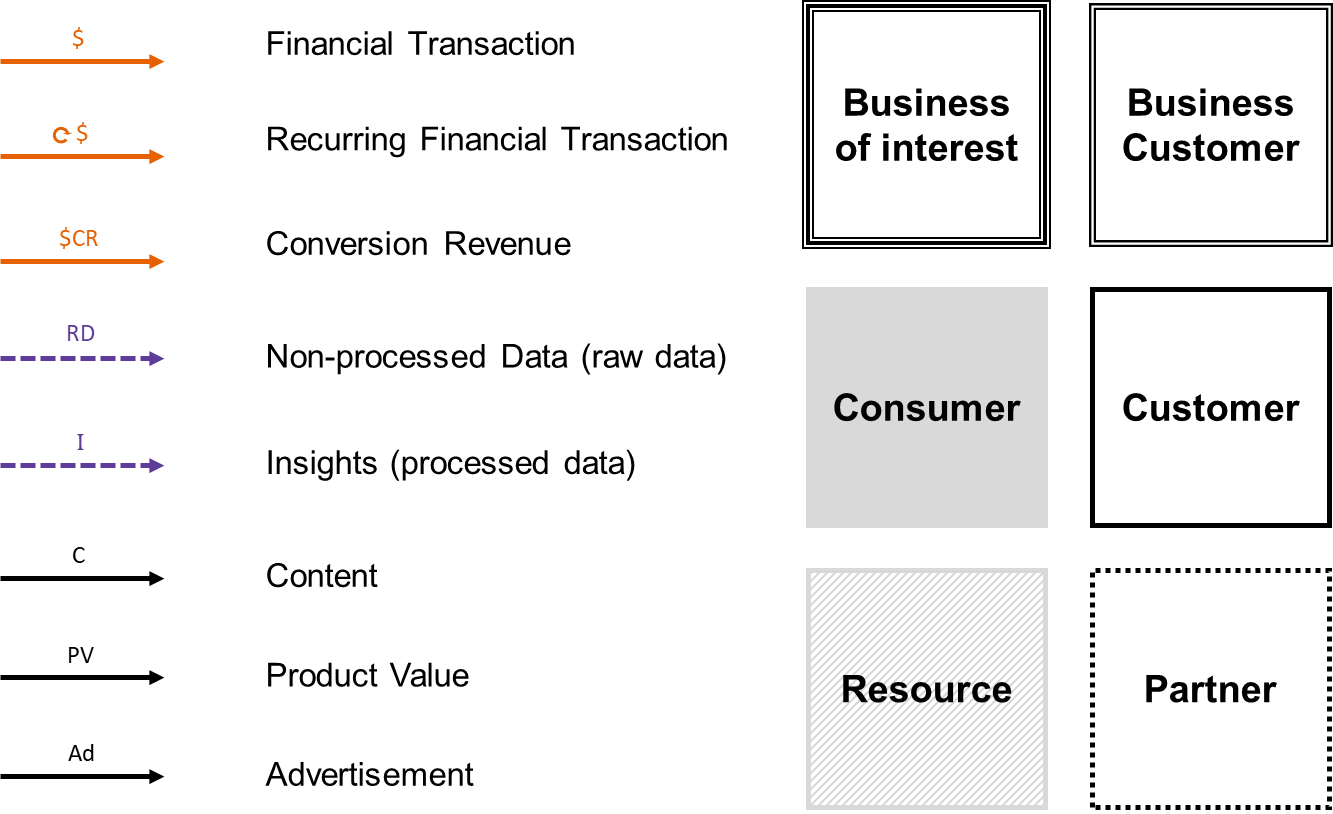
The first category includes financial value streams which are most desirable and essential to the business. These streams can be split into direct financial transactions and indirect flows, each of which can be one-time or recurring. An indirect flow would be conversion revenue that is generated for a business through consumers reacting to advertising. The second kind of value streams are those that are composed of data - either non-processed/ raw data or insights that have been identified in data. The third category of value stream is product value. This can be generic product value, or more specific value in terms of content or maybe even advertisement. A brief legend of how these value streams are going to be depicted in the business model schematics can be found in Figure 8.

Continue with:
