
Examples and Classification of Data-Based Businesses
by Max von BeustThis is part 7 of my master thesis on Monetization Strategies and Business Models Behind Consumer Data. Find other chapters here:
4.4 Data-Based Business Models in Practice
The following analysis of different cases of business models includes ten examples from a diverse range of industries. The companies or products were selected since they represent a multitude of distinctly different business- and monetization models. In addition to that, they show different degrees of innovativeness, are established within their field, are financially successful, and are pioneers of the specific way of using consumer data models. Each business will be described by briefly highlighting its background, value proposition, monetization model, use of data, capabilities and business model.
4.4.1 Case 1: Acxiom
One of the most influential yet unknown American companies, Acxiom, will be the first to be analyzed. The Acxiom Corporation
was founded in 1969 and is a data and technology company that operates internationally in the fields
of data collection, -consolidation and database marketing – it is not an online business. As a result,
it has built “the world’s largest commercial database on consumers” (Singer, 2012). (Bloomberg, 2018a)
Acxiom operates in a business-to-business (B2B) environment with consumer data as its main value stream.
The value proposition towards its customers is twofold: access to a wide range of consumer (identity)
data and the unification of consumer data from diverse sources for enhanced marketing and consumer activation.
Acxiom charges its business customers based on the traditional transactional model - each data set and
insight is sold individually. Acxiom does not have a direct value proposition towards the source of its
data - so users do not directly benefit from the direct data collection by Acxiom, making the user a
resource rather than a partner. (Singer, 2012)
Acxiom does not have a direct value proposition towards the source of its data - so users do not directly benefit from the direct data collection
The company uses a wide variety of the data sources listed in chapter 3.1.2. Next to direct data collection from individuals,
the company works together with retail businesses, agencies, insurance companies, banks and other consumer-facing
companies to unify transactional, social, behavioral, demographic, financial, educational and locational
data. For individuals in the UK market, Acxiom collects data on 178 variables in 21 different fields
of data collection. Besides collecting, acquiring and transferring the data, Acxiom stores, distributes
and exploits data. Exploitation happens in a descriptive and predictive manner with the possibility of
visualizing data and insights. (Acxiom, 2017)
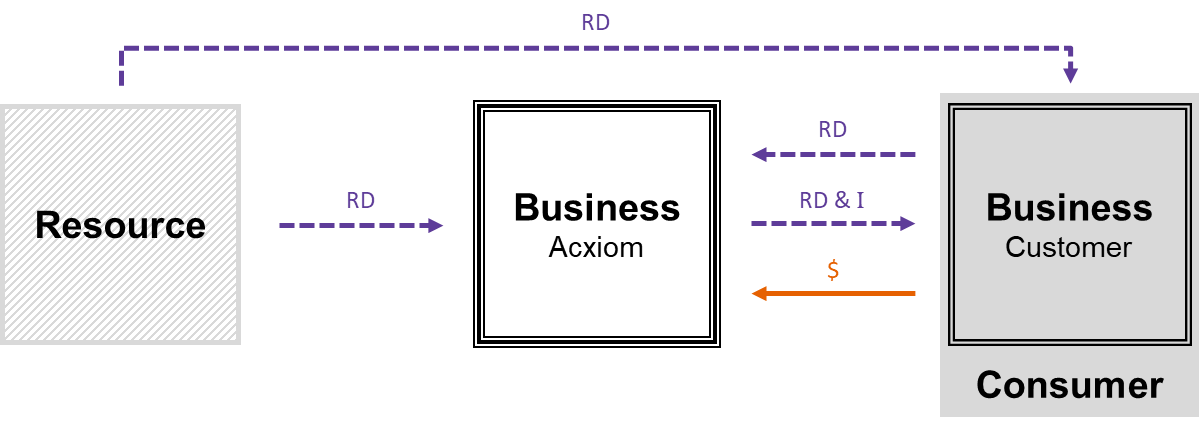
Therefore, the business model applied by Acxiom has three main actors: the user as the data resource,
a business customer (simultaneously being a consumer) and Acxiom, where Acxiom is collecting data from
both (and other players) and re-selling it to the business as seen in Figure 9.
4.4.2 Case 2: Google Adwords
It is hard to imagine that one of the giants of the current web was once struggling for revenue and it
was one product that changed the path that Google would take: From the best search engine of the web
that redefined how people used the web, to the dominant player in online marketing that disrupted online
monetization. Google Adwords was launched in 2000 and enabled advertisers to be placed on top of the
most relevant search results, promising companies to target the most valuable users who had already shown
clear interest in the value proposition of the advertised product. (The Economist, 2004)
The exact mechanism of Adwords’ monetization model has been described in chapter 2.4.1 on the advertising
model. The basic idea is to place ads on Google’s own properties or on external websites (consumers of
value) that are paid for every successful interaction between the user and an ad. Consequently, the user
is identified as the partner for Google.
Google collects data from the user in return for delivering product value through search results and
other forms of content. The company hereby does not only rely on the development of online profiles,
but also includes spatial, movement and transactional data. These data points are then aggregated and
analyzed, and enable Google to serve ads that are customized for the user/ partner. The goal of an ad
is to facilitate a transaction between the partner and the customer.
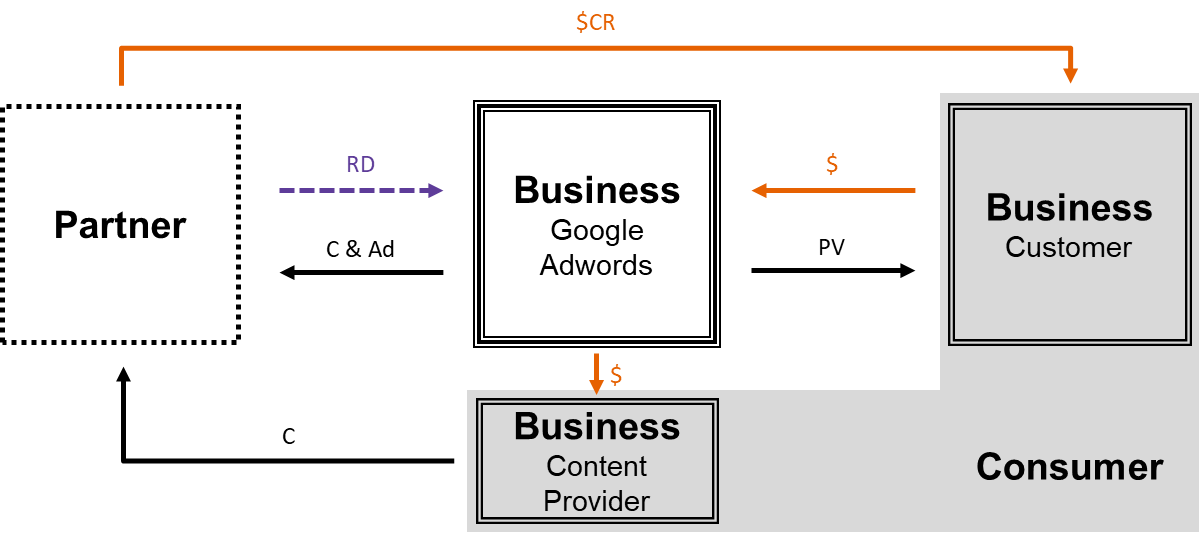
Consequently, the initial financial value flow occurs between the advertiser (customer & consumer) and
Google, and is based on predefined success metrics. There is no financial transaction between Google
and the user (partner). Google is able to charge its customer for its service because it creates value
that is materialized in conversion revenues the customer earns from the user as depicted in Figure 10.
4.4.3 Case 3: Amazon Echo Look
Moving from one of the most influential search engines to the biggest e-commerce company (Deloitte, 2018, p. 19), Amazon,
and its recently introduced product “Echo Look”: The product is an addition to the Echo home speaker
lineup of Amazon built to support the AI-based voice assistant “Alexa”. Alexa is able to respond to a
wide variety of human speech commands, answering questions, controlling smart home devices, ordering
products, supporting during everyday activities and much more, based on its understanding of the user
(Palladino, 2017).
Echo Look expands its value proposition beyond the advantages of Alexa with its capability of collecting
and analyzing visual and spatial information. The main additional feature of Echo Look enables the user
to take a picture (or record a video) of themselves; the companion app will then rate the user’s outfit
and style and recommend fitting clothing (Lomas, 2017). These recommendations (or ads) are based on human
“style assistants” and the Rekognition AI software capabilities of Amazon. In order to enable, improve
and potentially build new features, all data is transmitted to and stored on Amazon’s servers (Heater,
2017).
Echo Look enables the user to take a picture (or record a video) of themselves; the companion app will then rate the user’s outfit and style and recommend fitting clothing
Although Echo Look currently retails at a $200 price point, the main revenue generation will largely be based upon (fashion) recommendations and, possibly, anticipatory shipping of products (Roemmele, 2017; Spiegel et al., Amazon Technologies Inc, Patent No. US8615473B2, 2012). Thus, Amazon bases its monetization model for Echo Look on the strength of its e-commerce model (see Figure 11), where the flywheel (Haden, 2014) is accelerated by additional data-based conversion revenue as well as on building a more attractive product by improvement through data analytics.

4.4.4 Case 4: Netflix
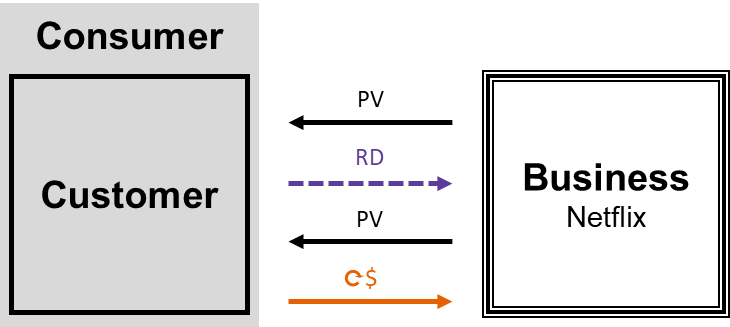
Although Netflix started its business in 1997 in the offline world by selling DVDs, the company has evolved into one of the most data-focused companies on the internet, providing video streaming services to 117 million users in 190 countries (Bloomberg, 2018b). Its main differentiating factors are original content, personal recommendations and pricing. Netflix charges its customers a fixed monthly fee in a subscription model after a trial period (as seen in Figure 12). The fee increases depending on how many devices actually use the service and the maximum available image quality of content (Netflix, 2018).
The company records ~500 billion events per day
In order to be able to deliver a state-of-the-art product, Netflix exploits customer data in various ways. In line with the theory of the attention economy (Harris, 2016), one of the main goals of the company is to maximize the time people spend with Netflix. To reach this goal, Netflix analyzes the customer’s behavior in terms of their viewing history, their behavior in interaction with the content (pausing, skipping etc.), their selection of content and the devices the content is consumed on, hereby creating a consumer data model that allows Netflix to cater to the specific customer preferences and potential future demands (Fisher-Ogden et al., 2015). The company records ~500 billion events per day (Wu et al., 2016) and stores them on external servers (Kosewski et al., 2018). Moreover, it decides which content to recommend to its consumers, which artwork to display to the user and what kind of content to produce (competitors such as Amazon Video apply the same techniques) (Wernicke, 2015). Netflix’s business model benefits from users continuously using the product and thereby ignoring competitors. Data is employed to build and personalize the best product for each individual customer.
4.4.5 Case 5: Progressive Snapshot
Progressive is another company that has managed the transition from offline business to data-based business. The company provides personal, property and commercial insurance services in the United States (Bloomberg, 2018c). The product of interest for this case is their “Snapshot” offer to customers, which is car insurance with an adjustable deductible dependent on driving behavior.
These developments might undermine the concept of insurance which is based on pooling risk
The company offers customers discounts if their driving behavior has clear indicators for a lower insurance risk. The snapshot
program collects data (telematix) about the car’s location, its speed, deceleration, time traveled and
other on-board diagnostics (Davenport, Kudyba & Paul, 2017; Senary, 2011). These insights allow Progressive
to accurately predict risks and change the driver’s behavior by giving advice, following incidents which
may have a negative impact on the rating. Progressive uses both an on-board device and an app to track
its (prospect) customers to create a unique, personalized insurance contract for them.
As most insurances do, the company uses a subscription model for monetization, although it can be argued
that the model is moving to a pay-per-use model where risk is calculated for the individual and the insurance
thus comes closer to charging for real cost rather than mere risk. These developments might undermine
the concept of insurance which is based on pooling risk. (Kaminska, 2016)
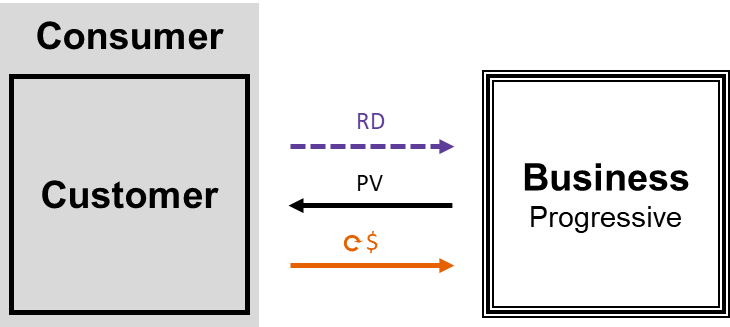
Progressive Snapshot works based on the idea of improving a product for the customer and reducing the
cost of the respective product for both customer and business (as seen in Figure 13) by collecting and
analyzing behavioral data.
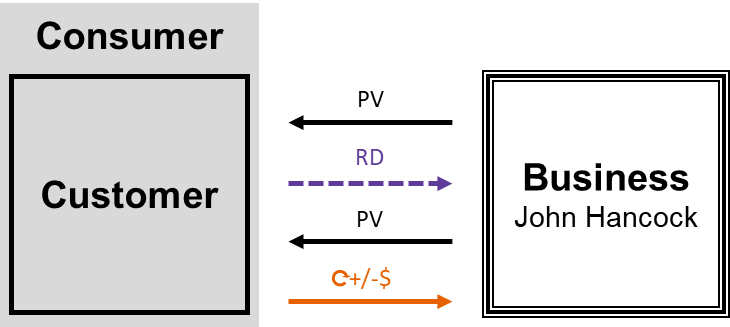
4.4.6 Case 6: John Hancock Vitality Program
John Hancock, a life- and health insurance provider in the United States, offers its customers customized deductions and
free tracking devices in return for data. The “Vitality Program” is only one offer out of a long list
of personalized health insurance services by providers such as Aetna, Qantas Assure or Oscar (Purbasari,
2016).
Monetization, once again, follows the traditional subscription model, but Vitality adds an additional
component to this model. The customer receives a significantly discounted health tracking device and
has to pay a fee for the device ownership, should certain pre-set fitness goals not be achieved (John
Hancock, 2018). Through fitness activities (and data transmission), the customer earns an in-app currency
which can be used to pay insurance deductions or other online services. The device tracks and transmits
movement, sleep, heart rate and further fitness as well as location data. These data points are aggregated,
analyzed and shared through application program interfaces (APIs) and displayed to the customer via a
mobile app. Recent studies have shown that this data can be used prescriptively as well, identifying
illnesses preemptively (Tison et al., 2018). The Indian insurance GOQii already uses these mechanisms
to ask their customers to see a doctor ahead of time or schedule online appointments (Acharyya, 2017;
The Indian Express, 2017).
data can be used prescriptively as well, identifying illnesses preemptively
Accordingly, the overall business model only involves the customer and the business (as seen in Figure 14), with some additional actors that are within the data value chain for collection and analysis purposes. The business improves the service for the customer as well as offering a free product in return for data and risk reduction (more movement leads to better health, leading to lower health insurance risk).
4.4.7 Case 7: Fitbit
Staying within the realm of health-related products, the public company Fitbit is a prominent case example for the potential
of data-based business models. Although the majority of its $1.6 billion revenue is based on hardware
sales, one of the core differentiating factors for its products stems from its software capabilities
(Fitbit Inc., 2018). The main value proposition of the company is to offer consumers insight into their
health, with the added benefit of tailored fitness programs for each individual consumer.
The company monetizes this offer through the initial e-commerce hardware sale (the products are also
available offline) – as depicted in Figure 15. The hardware can be combined with a free app with insights,
but personalized services are only available with a monthly subscription in the traditional freemium
model. To provide these services, Fitbit collects a wide variety of data about each individual consumer:
movement, heart rate, activities, location, sleep, altitude, payments and information about music played
(sometimes even dietary information). All these factors allow the company to create a fully transparent
model of the consumer (Fitbit, 2017, Fitbit, 2018b).
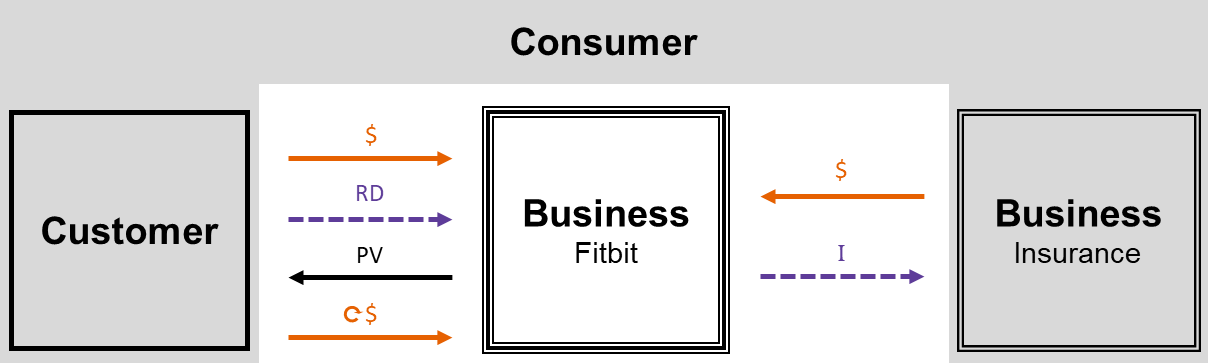
This data is not only used by Fitbit to determine which new products to develop and how to personalize and improve the service for the customer, the company also uses the insights that can be derived from the data to build a two-sided business model. These insights are sold to insurances on an aggregated level, so that they can customize their offer (less physical activity in your region might lead to higher deductions - see https://www.fitbit.com/en-ca/activity-index for an example) (Fitbit Inc., 2018; Menegaz, 2014). Fitbit has built a business model, where consumer and customer can both be found in the business-to-consumer (B2C) as well as the B2B environment and revenues are generated through hardware sales and data-based offerings, as depicted in Figure 15. A similar model is applied by the IoT company Nest. (Mombrea, 2014)
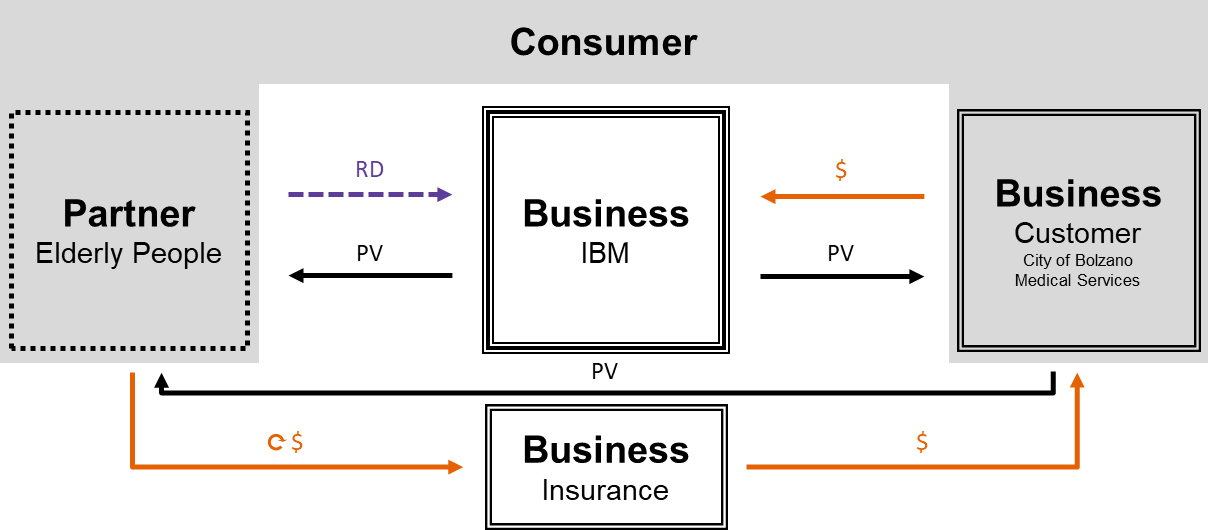
4.4.8 Case 8: Bolzano IBM Project
The “Abitare Sicuri” (“secure living”) project of IBM in Bolzano (Italy) is the only case that has not been commercialized,
although the company CurrentCare has a very similar offer in the UK (Current Care, 2015). IBM was trying
to solve the problem of the city council of Bolzano, where the aging population was in need of assistance,
which could not be met by local caring homes. The company implemented a solution that enabled consumers
to stay in their apartments while receiving the assurance of automated, reactive and preemptive support
services at a reduced cost.
IBM collected data through sensors in the apartment as well as on the body of the consumer. Data points
about temperature, humidity, carbon monoxide/ dioxide levels, methane, smoke, electricity and water usage,
blood pressure and motion were analyzed on an individual and aggregated level in order to identify irregular
developments or spontaneous changes in behavior (IBM, 2016). A support team would then alert a medical
assistant, or make preventive appointments with doctors (TIS Innovation Park, 2009).
In the case of IBM, every step within the data value chain was in-house - from data collection to prescriptive
analytics. IBM was not charging the elderly, but rather medical services and the city which would provide
assistance to them. The receivers of care would then pay for assistance through their insurance. Thus,
the elderly were a partner for IBM, the business that enabled the transaction of value and money between
its partner (data source) and customer as seen in Figure 16. CurrentCare, on the other hand, opted for
monetization through a subscription model, charging the monitored person for the value provided on a
daily basis (Current Care, 2015).
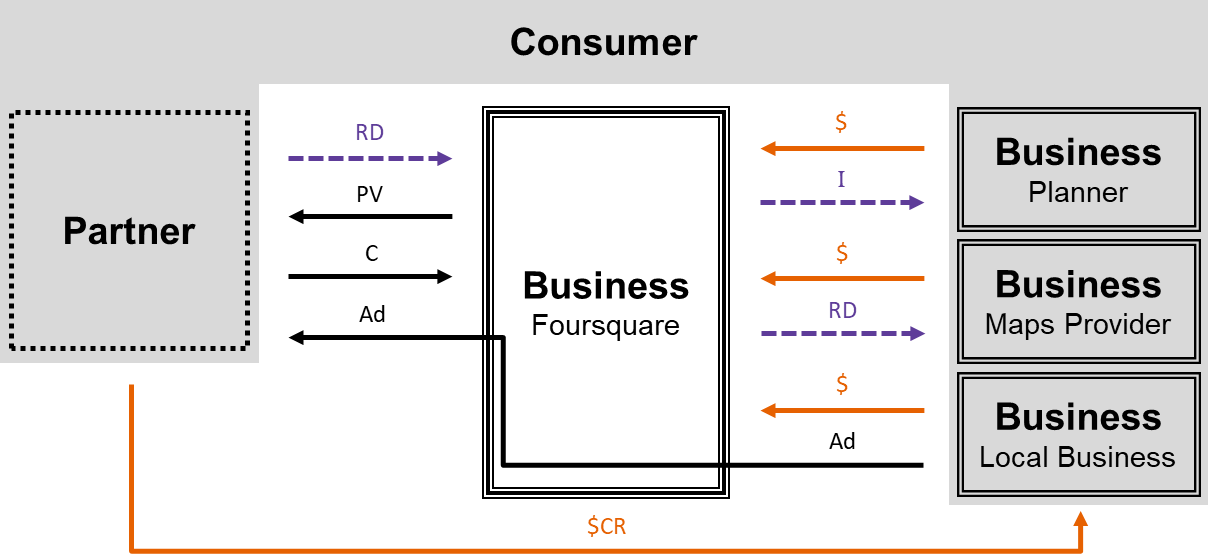
4.4.9 Case 9: Foursquare
A company that combines aspects of most of the previous examples is the location-based technology company Foursquare. The
company provides users with a city guide app for finding and reviewing places, as well as the social
lifelog app Swarm. Before its pivot in 2014 the company was mainly based on the traditional advertising
model, albeit with the added intelligence of spatial awareness and the data models it had built of its
consumers (Foursquare for Business, 2018).
It was the shift to a two-sided business model that changed the business outlook of Foursquare. The company
started to provide aggregated location and movement insights to city planners, real-time information
to third party developers and in-depth databases of information about places to map providers and location-aware
services (e.g. Apple Maps, Here, Snapchat, Twitter, etc.) (Finley, 2016). Two years after the pivot,
those parts of the business model that were based on a pay-per-use monetization model, contributed more
than 40% to the company’s overall revenue (Carpenter, 2016).
Two years after the pivot, those parts of the business model that were based on a pay-per-use monetization model, contributed more than 40% to the company’s overall revenue
Foursquare was able to build this strong two-sided business model (see Figure 17) by collecting UGC and locational data, hence making the user a traditional partner to the business. The company then embraced its analytics skills, while keeping data storage, transfer and processing outsourced to build a new product for its new target group (i.e. businesses) (Amazon Web Services, 2011; Miller, 2017). These businesses then evolved to be Foursquare’s customer which enabled Foursquare to gain partial independence from advertising revenue.
4.4.10 Case 10: Palantir
Palantir is one of the most successful and controversial companies of Silicon Valley (Desmond, 2017; Peretti, 2017). The
company provides data analysis and insight services to government and state agencies as well as to private
corporations - these organizations usually deal with highly sensitive and proprietary data. Palantir
is able to design applications that enable everything from personal identification through tattoos and
DNA (Woodman, 2017) to predictive policing (Winston, 2018) and fraud protection to military suspect tracking
(Burns, 2015) - all of it in real-time.
The company is built upon data analysis and will build new product analysis components as soon as the
potential data sources and customers are identified. Its monetization model is subscription-based and
prices are set depending on the customer’s willingness to pay (Wang, 2015). Nonetheless, the company
does not collect the data it analyzes. Its customers collect the data; Palantir then aggregates and analyzes
the data to sell insights and product components (Bennett, 2015). Each analysis component that Palantir
builds is sold through a separate subscription, with the addition of customers having to pay for upgrades
of the individual modules.
Palantir is able to design applications that enable everything from personal identification through tattoos and DNA to predictive policing and fraud protection to military suspect tracking - all of it in real-time
The private citizen is only the data resource, receiving no direct value from the company as seen in Figure 18 (indirect value might be provided through the potential creation of public safety), whereas Palantir is able to benefit from this data due to nation-wide (and even international) aggregation and analysis provision.

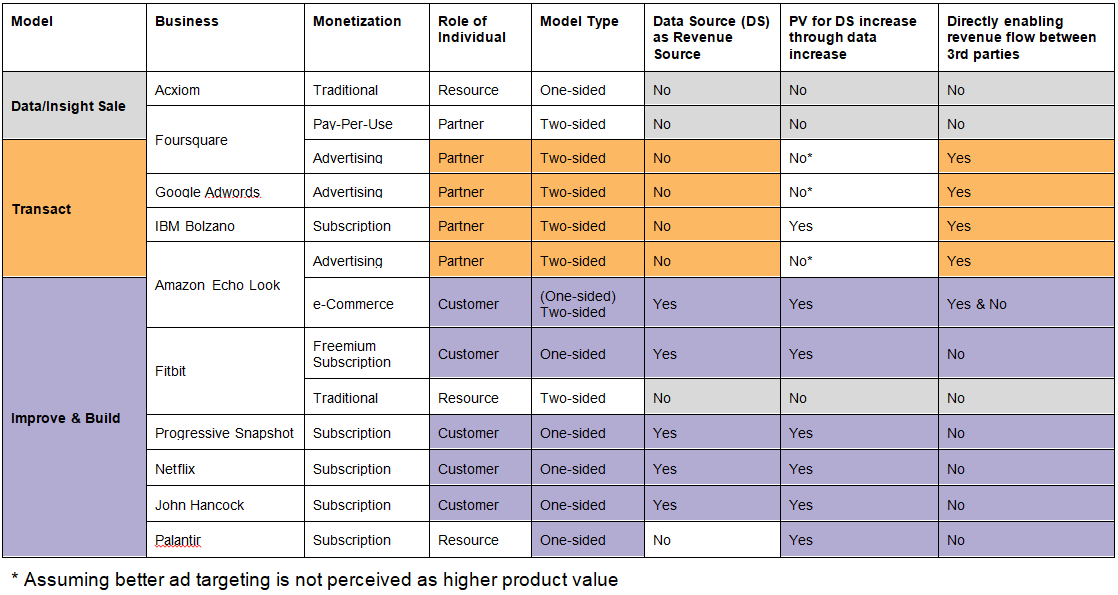
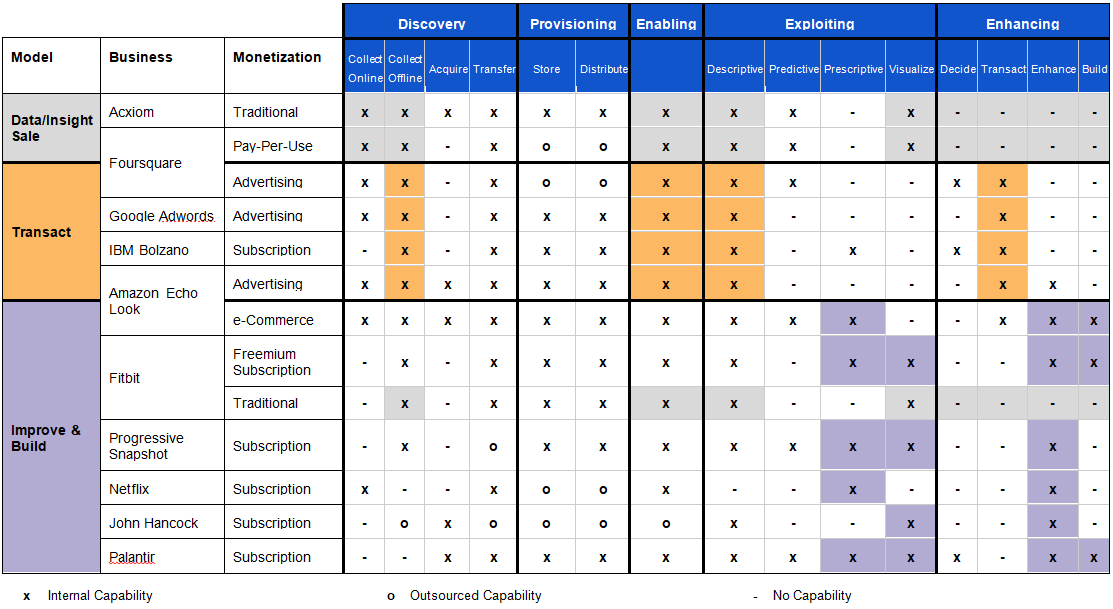
4.5 Classification of Data-Based Business Models
In an analysis of the ten cases, three different models can be identified and differentiated based on a combination of several criteria. These criteria can either be within the capabilities of the data-based business or in the combination of factors for value generation within the business model. An overview of all ten cases and their classification into the presented models can be found at the end of this post.
Data or Insight Sale Model
The most traditional model can be identified as the “data or insight sale model”. The primary example
for this model is the case of Acxiom, but it can also be found as a part of the business model of Foursquare
(and even in the insight sale aspect of Fitbit). In this model, the individual who is the data source
is not the generator of revenue and the companies do not necessarily have a value proposition towards
the individual. In these cases, the customer of the business is another business that receives either
non-processed data or insights in return for the financial transaction.
data is not used for decision-making or any other enhancing activities
As far as the capabilities of the businesses in the “data or insight sale model” are concerned, the companies are strong in the data discovery phase (collection and acquisition of data) and do exploit and process it. However, this data is not used for decision-making or any other enhancing activities, which makes this model the simplest and most rudimentary kind of data-based model. A general depiction of the scheme of the “data or insight sale model” can be seen the following Figure 19.

Transactional Model
In the next distinct model, the main difference is visible in the way the individual is embedded within
the overall structure of the business model. The individual still is not the source of revenue, but there
is a clear value exchange between the business and the individual. In return for providing access to
data, the company creates product value (which is also used to attract the user). Hence, the business
has to manage two sides of its business model: The relationship with the partner as the data source one
the one hand and the business customer as the revenue source on the other hand. The business has to create
a unique value proposition for both sides. Usually, value is created for the partner by third-party content
or a compelling free product. The customer can then benefit from the conversion revenue from ads that
are shown to the partner. This model is the only one that directly creates revenue for other players
in the business model as it enables a (financial) transaction between partner and customer. Hence, it
can be described as the transactional model as seen in Figure 20. Cases that allow for the identification
of this model are the advertising part of Foursquare and Amazon (although ads are mainly recommendations
in latter case), Google Adwords and the Bolzano IBM Project.
This model is the only one that directly creates revenue for other players in the business model as it enables a (financial) transaction between partner and customer
With regard to monetization, the advertising model is dominant in transaction-based business models. In order to be able to monetize through the advertising model, the businesses have to create defendable and lasting value for the partner, which delivers data, presence (for the network effect) and buying power. As a consequence, this model enables or requires the business to offer value to the partner at no financial cost, thus avoiding the problem of the penny gap.
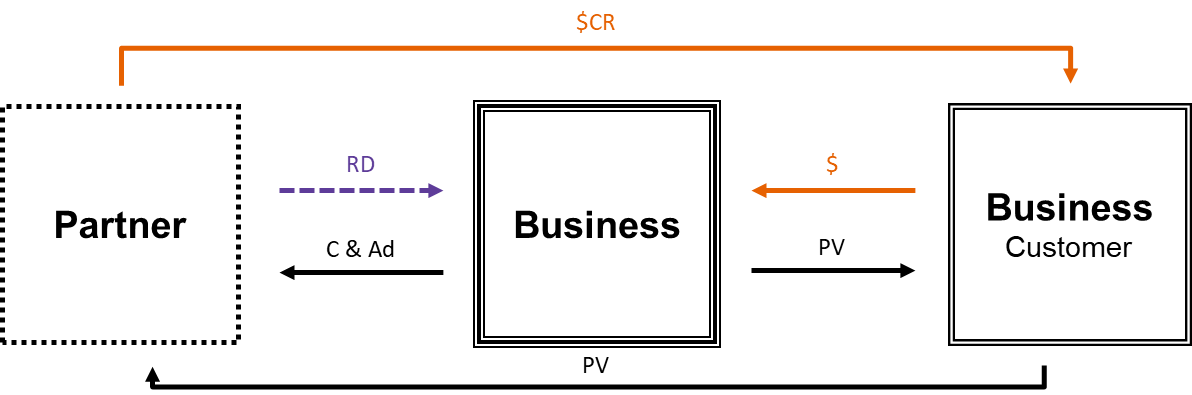
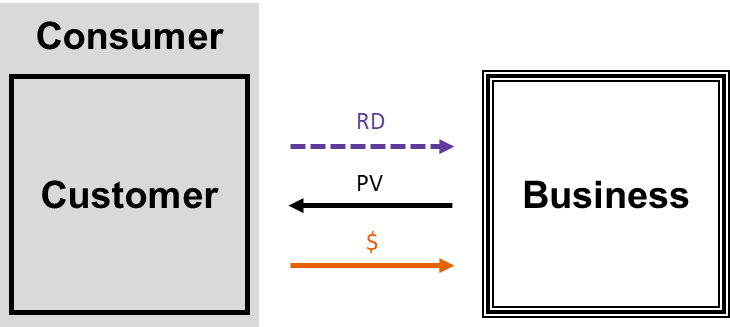
Improve and Build Model
The final model differs from the previous two in one key aspect: the individual that is the source of
data is also the revenue generator as seen in Figure 21. Therefore, an increase in data transmission
can lead to an increase in product value for the customer as the company uses the data in order to improve,
personalize or build products. These companies require the most sophisticated systems of customer understanding,
as their differentiating value proposition is dependent upon their data exploitation and enhancement
capabilities. As a consequence, the cases of Echo Look, Fitbit, Progressive Snapsho, Netflix, John Hancock
and Palantir do not necessarily focus their efforts on data collection, but rather on leveraging the
data they receive to create additional value. Where companies with “data/insight sale models” and “transactional
models” focus on descriptive, sometimes prescriptive analytics, “improve and build model”-businesses
often focus on prescriptive analytics (as is seen in Table 3). As a result, these companies are on the
forefront of developing new analytics technologies based on ML and AI, which might also have an impact
on how these companies work internally (Ng, 2017).
these companies are on the forefront of developing new analytics technologies based on ML and AI
In terms of monetization, it is evident that this model will not relieve the individual of a financial transaction, but rather relies on subscription or e-commerce models with the possible integration of freemium components.
It has to be noted that all these models can be combined. One example is demonstrated by Amazon Echo Look that combines the
“improve & build model” (product improvement of Alexa even after the initial purchase) with the “transactional
model” (better product recommendations which convert to revenue). Foursquare demonstrates the fusion
of the “transactional model” with the “data or insight sale model”, whereas Fitbit merges the “improve
& build model” with the “data or insight sale model”.
It is evident that the value that is delivered to the individual in return for the data that is collected
increases throughout these models. Where data is merely sold, the value tends towards zero; where data
is used to personalize a product, the value increases over time. Nonetheless, there is no clear homogeneity
within the models when it comes to their internal capabilities. An overview of all cases, their corresponding
criteria and models can be found in the following tables.
Continue with: